Current state of cancer
Cancer is responsible for Australia’s largest disease burden and is a leading cause of death.[1][2]
There are over one million people alive in Australia who are currently living with or have lived with cancer, with 164,694 people expected to be diagnosed with cancer in 2023.[1][3][4]
The most commonly diagnosed cancer in Australia* is prostate cancer, followed by breast cancer, melanoma of the skin, colorectal cancer, and lung cancer.[3] The most common cause of cancer-related death in Australia is lung cancer, followed by colorectal cancer, pancreatic cancer, prostate cancer, and breast cancer.[3] Rare and less common cancers comprise approximately one-third of all cancer diagnoses and 42% of all cancer deaths.[1]
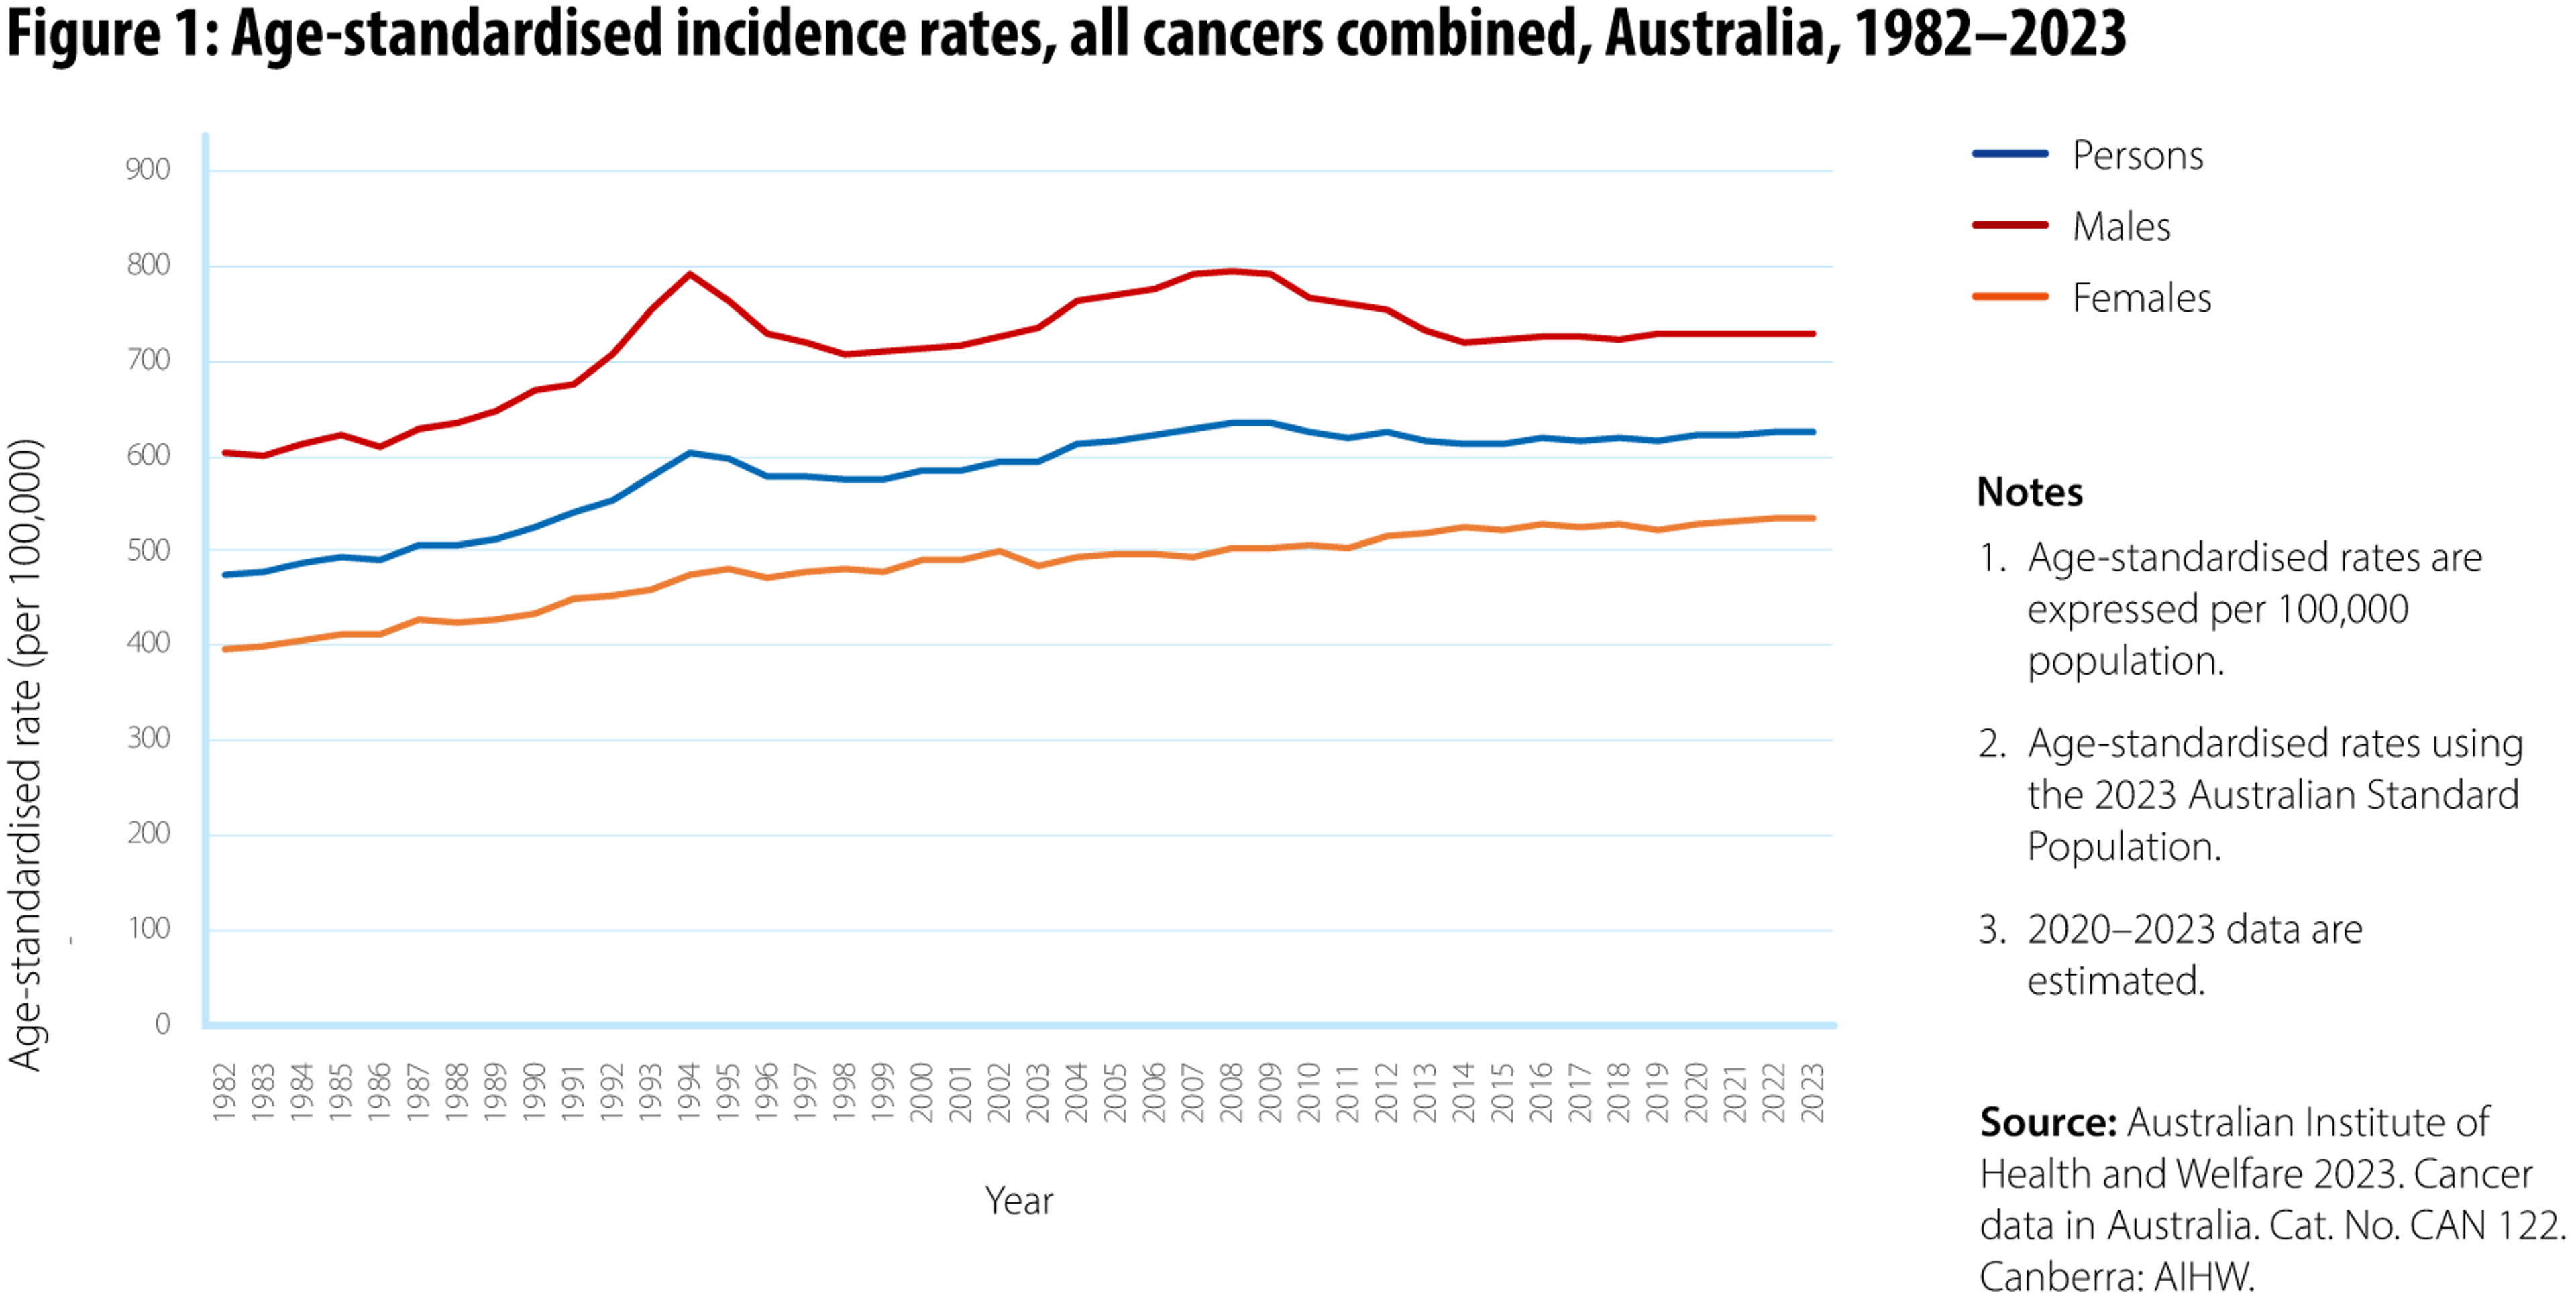
While the total number of people diagnosed with cancer has increased over the last three decades, this differs from the cancer incidence rate, which is the number of new cases diagnosed each year per 100,000 population. Cancer incidence rates trended upwards from 1982 to 2009 and have remained stable since (see Figure 1). This trend is observed for men in Australia, but the incidence rate has continued to increase among women in Australia.[3]
Additionally, the Australian population is expected to increase by 15% between 2021 and 2031 and cancer cases are estimated to increase by around 22% during this time.[1] Australia’s ageing population is expected to contribute to this increase in cancer cases and can explain why cancer incidence rates are exceeding the population growth rate.
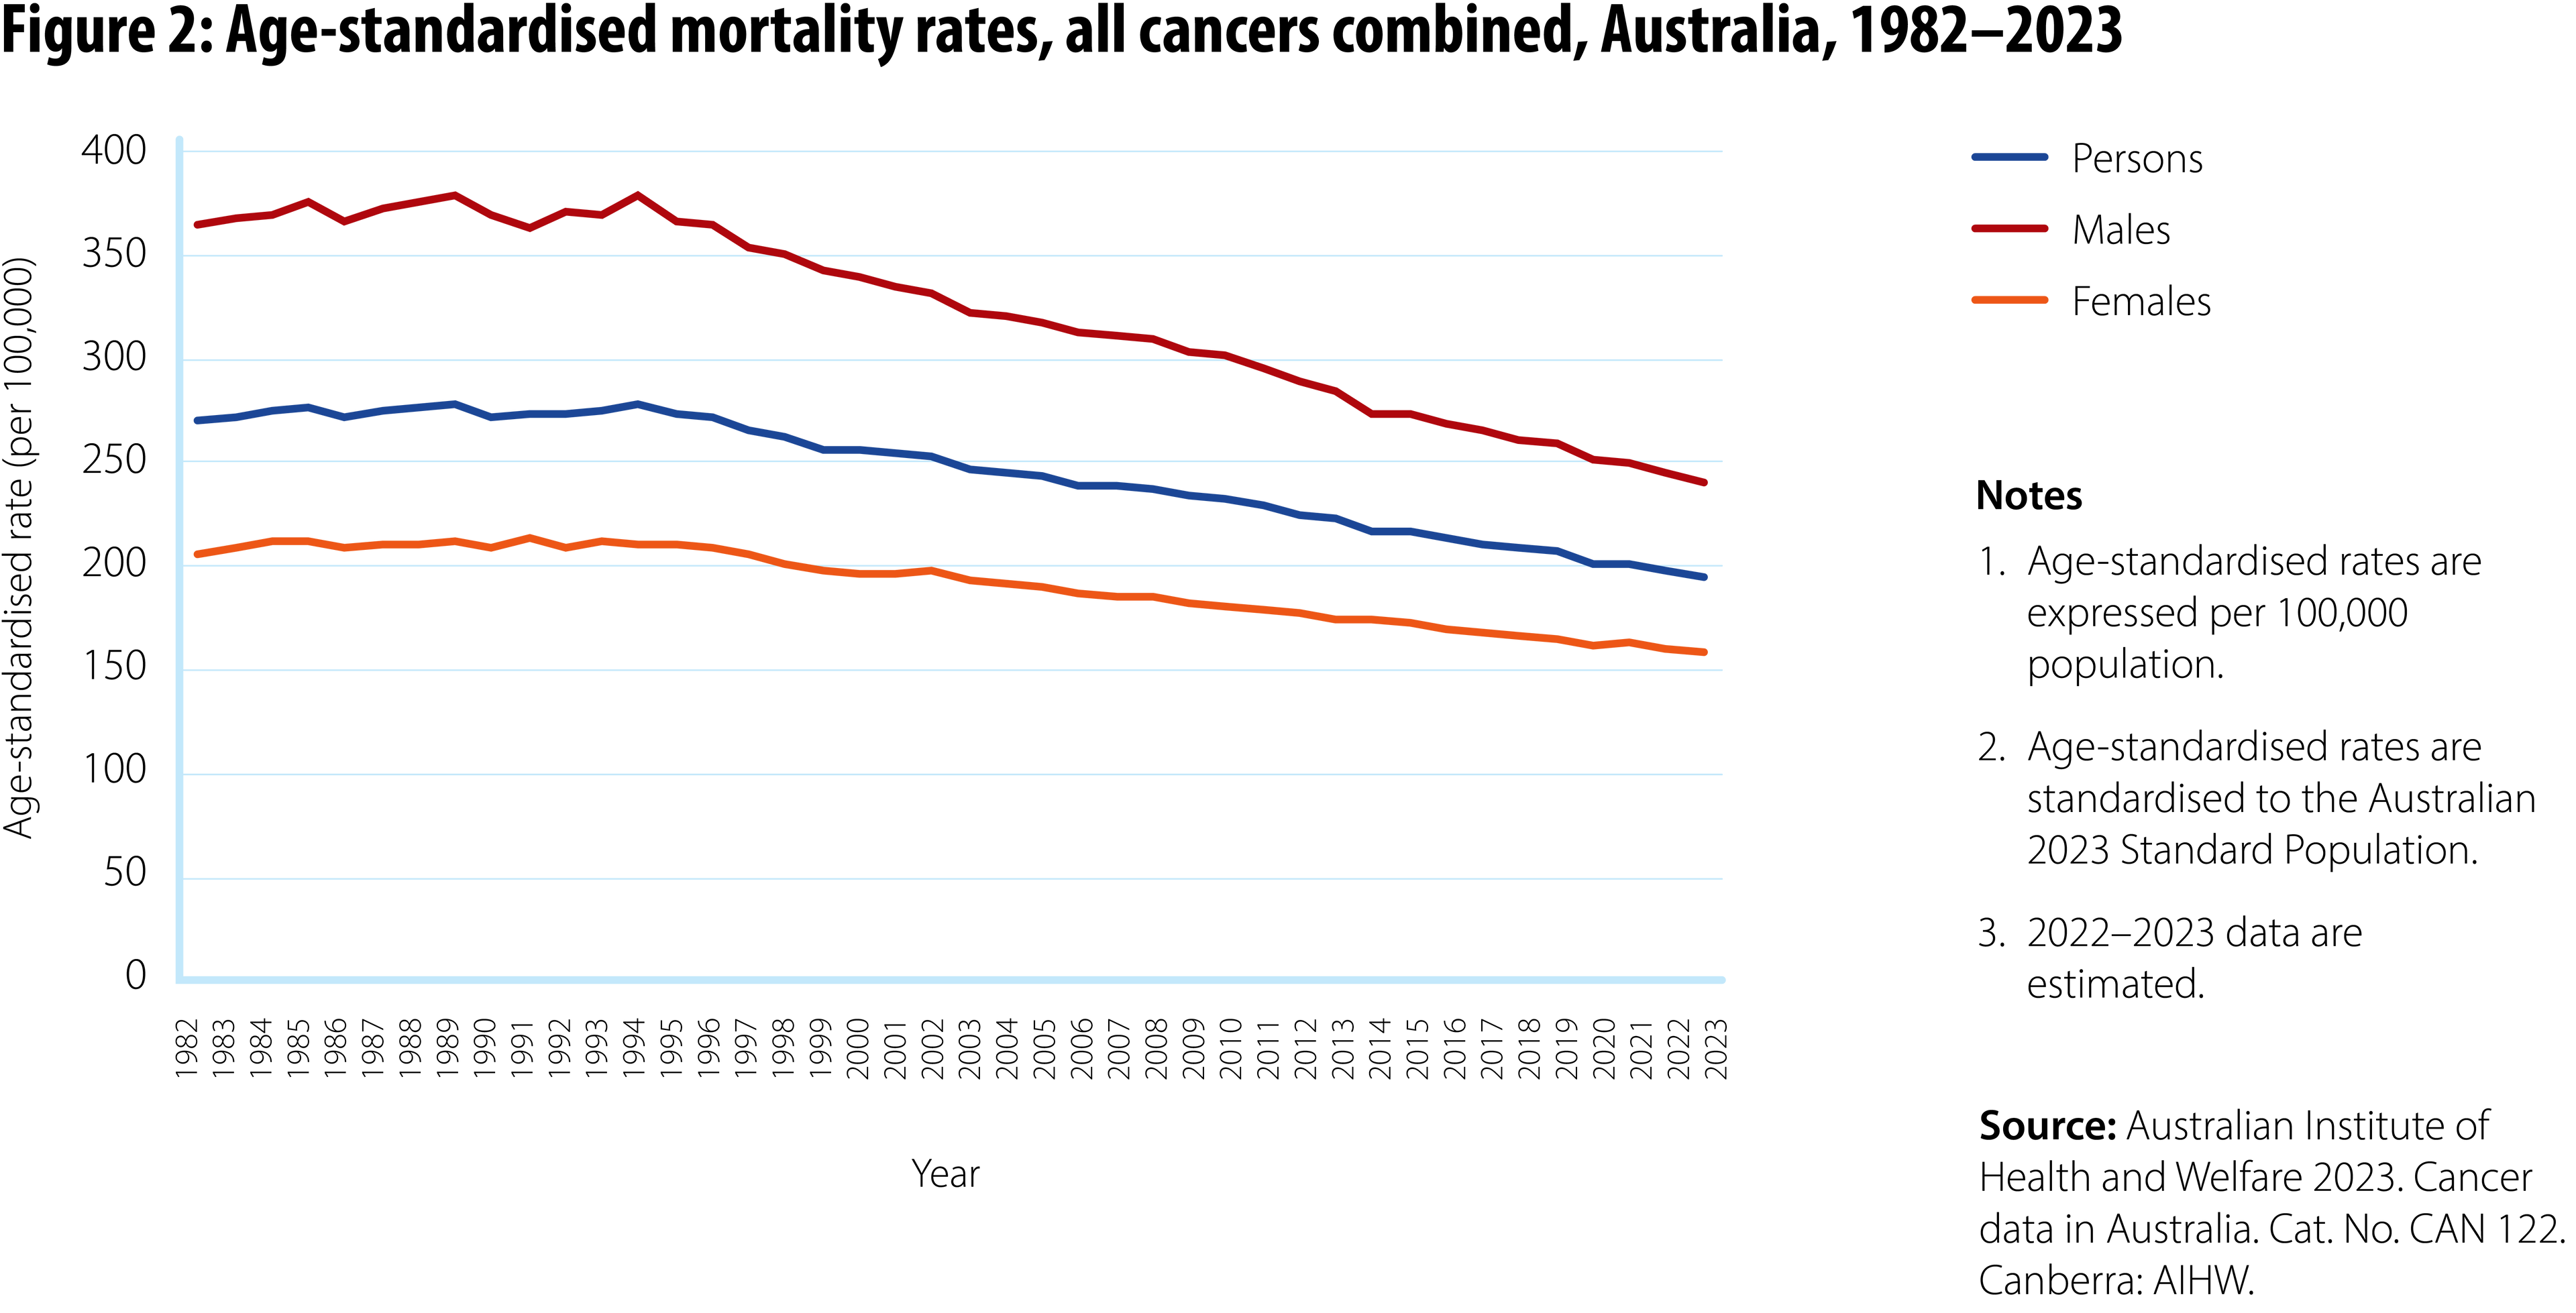
In 2023, it is estimated there will be 51,269 deaths from cancer in Australia.[3] While the absolute number of deaths has increased, cancer mortality rates have decreased over the past three decades (see Figure 2), with a sharper decline in cancer mortality observed for males than females.[1]
Improved survival rates have been observed at a whole of population level over the past 30 years. The number of people surviving at least five years after a cancer diagnosis has improved from 53% in 1990–1994 to 71% in 2015–2019.[3]
Overall, Australia has one of the highest survival rates from cancer in the world.[5][6] However, improvements in cancer survival rates are not experienced uniformly within the Australian population.
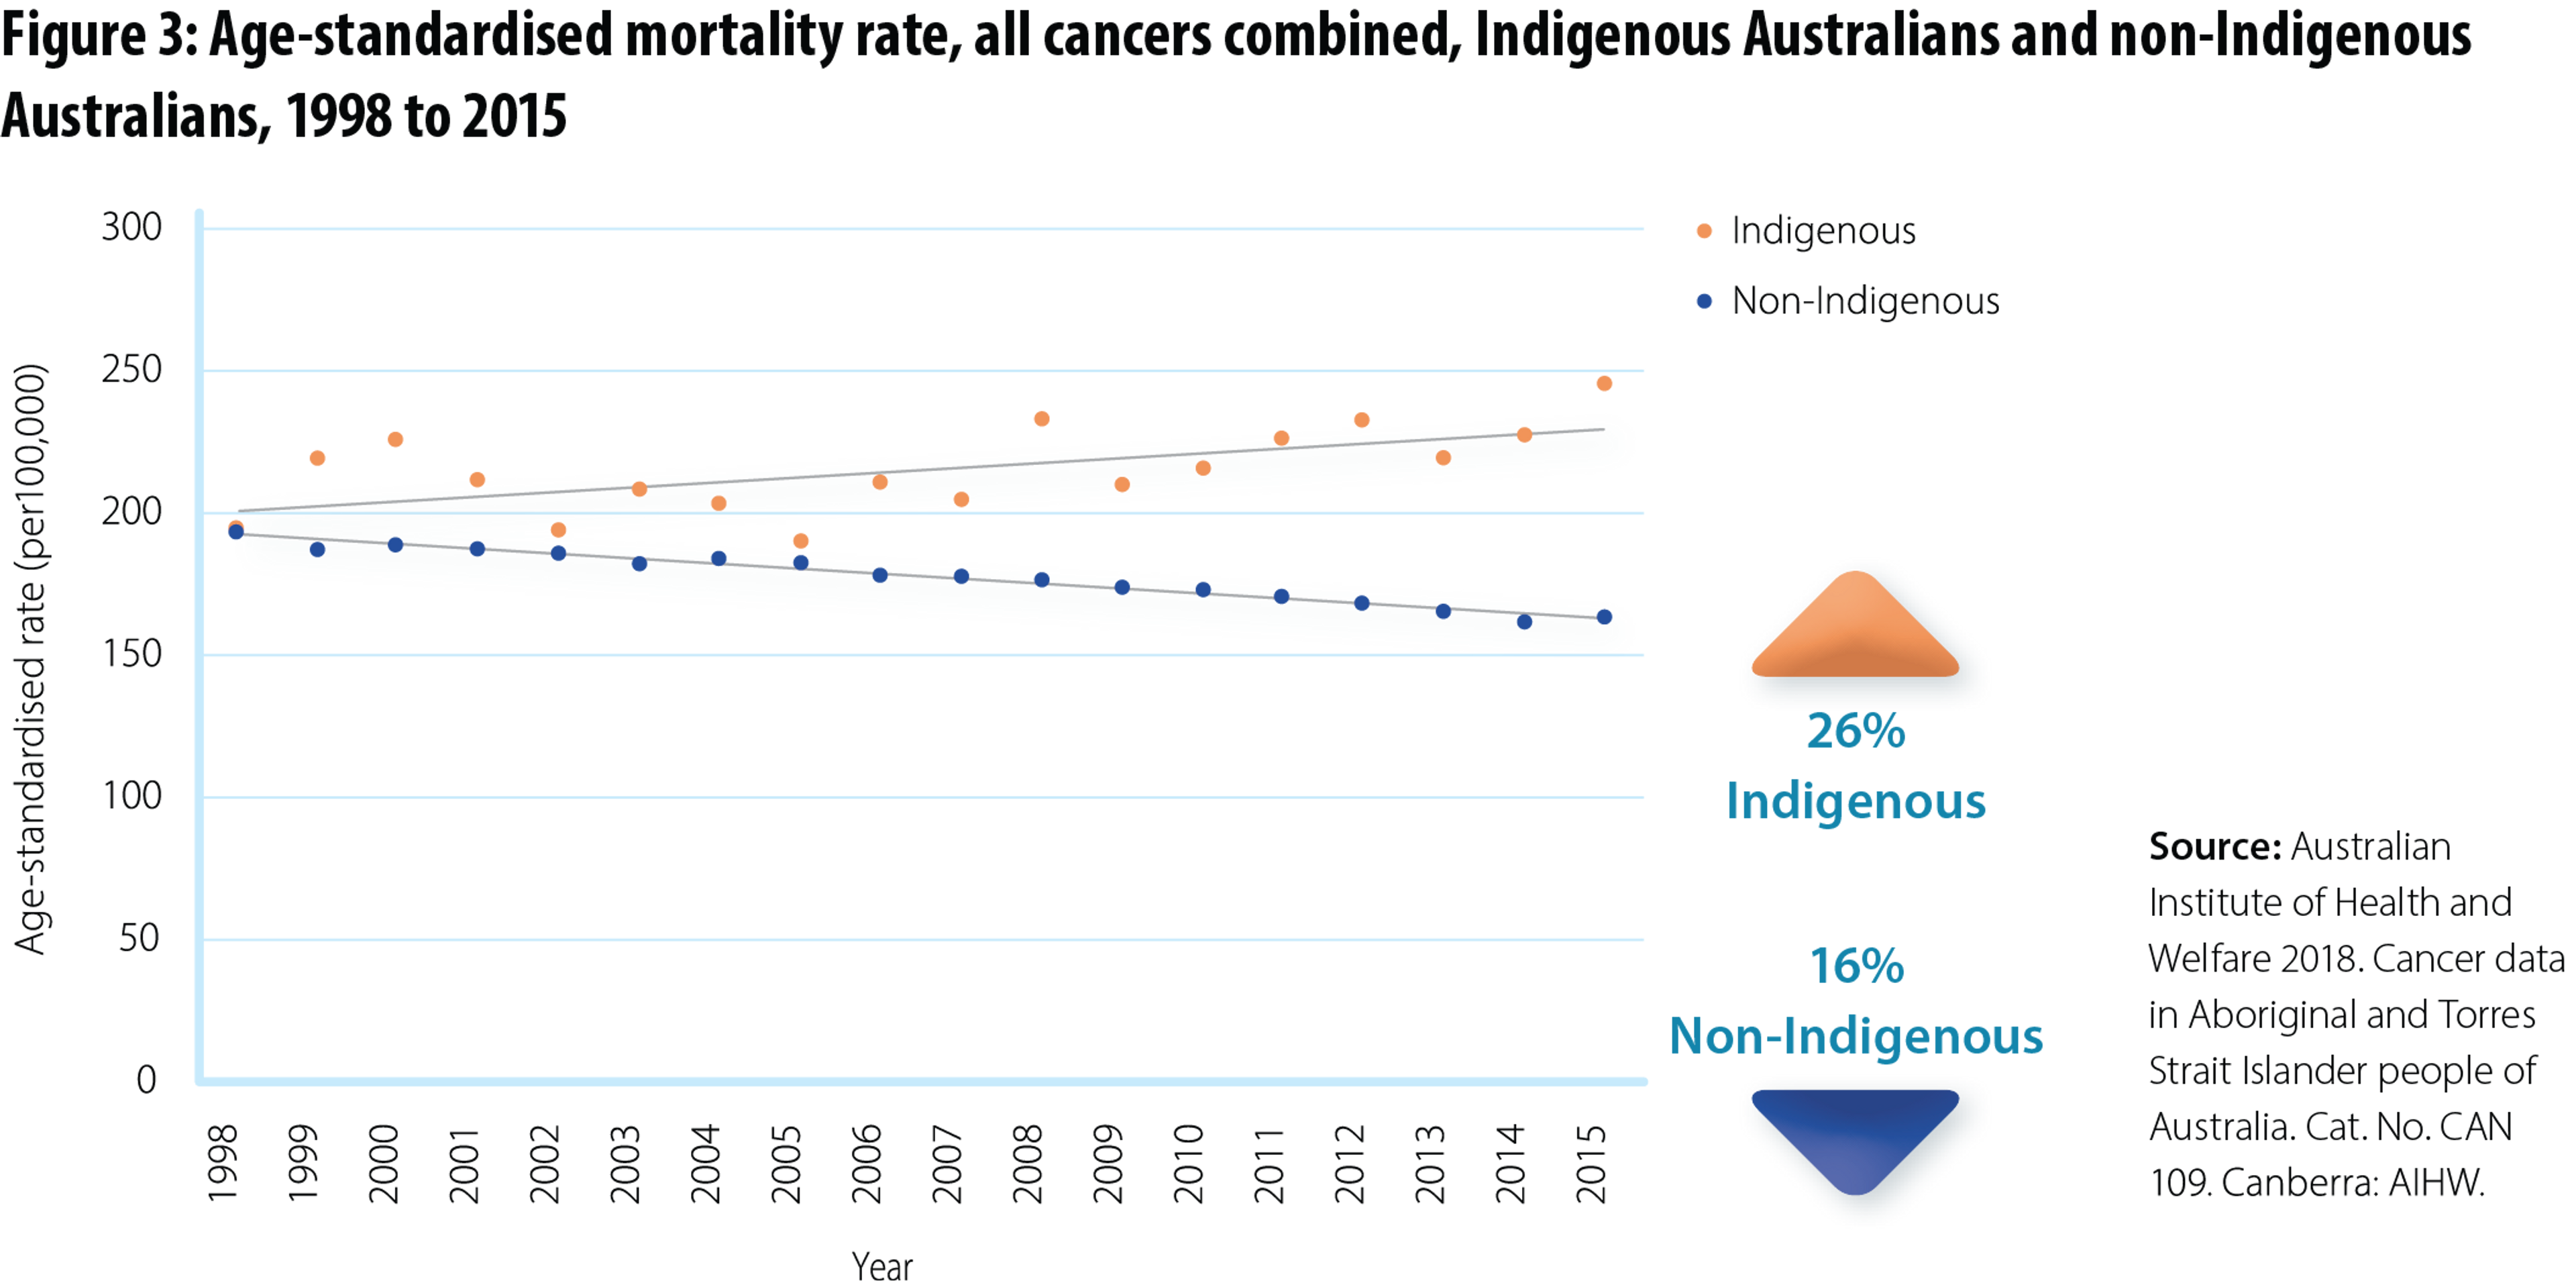
The gap in cancer mortality rates between Aboriginal and Torres Strait Islander people and non-Indigenous people is widening.
Australian cancer mortality data indicate that the age-standardised mortality rate for all cancers combined for Aboriginal and Torres Strait Islander people increased 26% between 1998 and 2015, and decreased for non-Indigenous people by 16% during the same period (see Figure 3).[7]
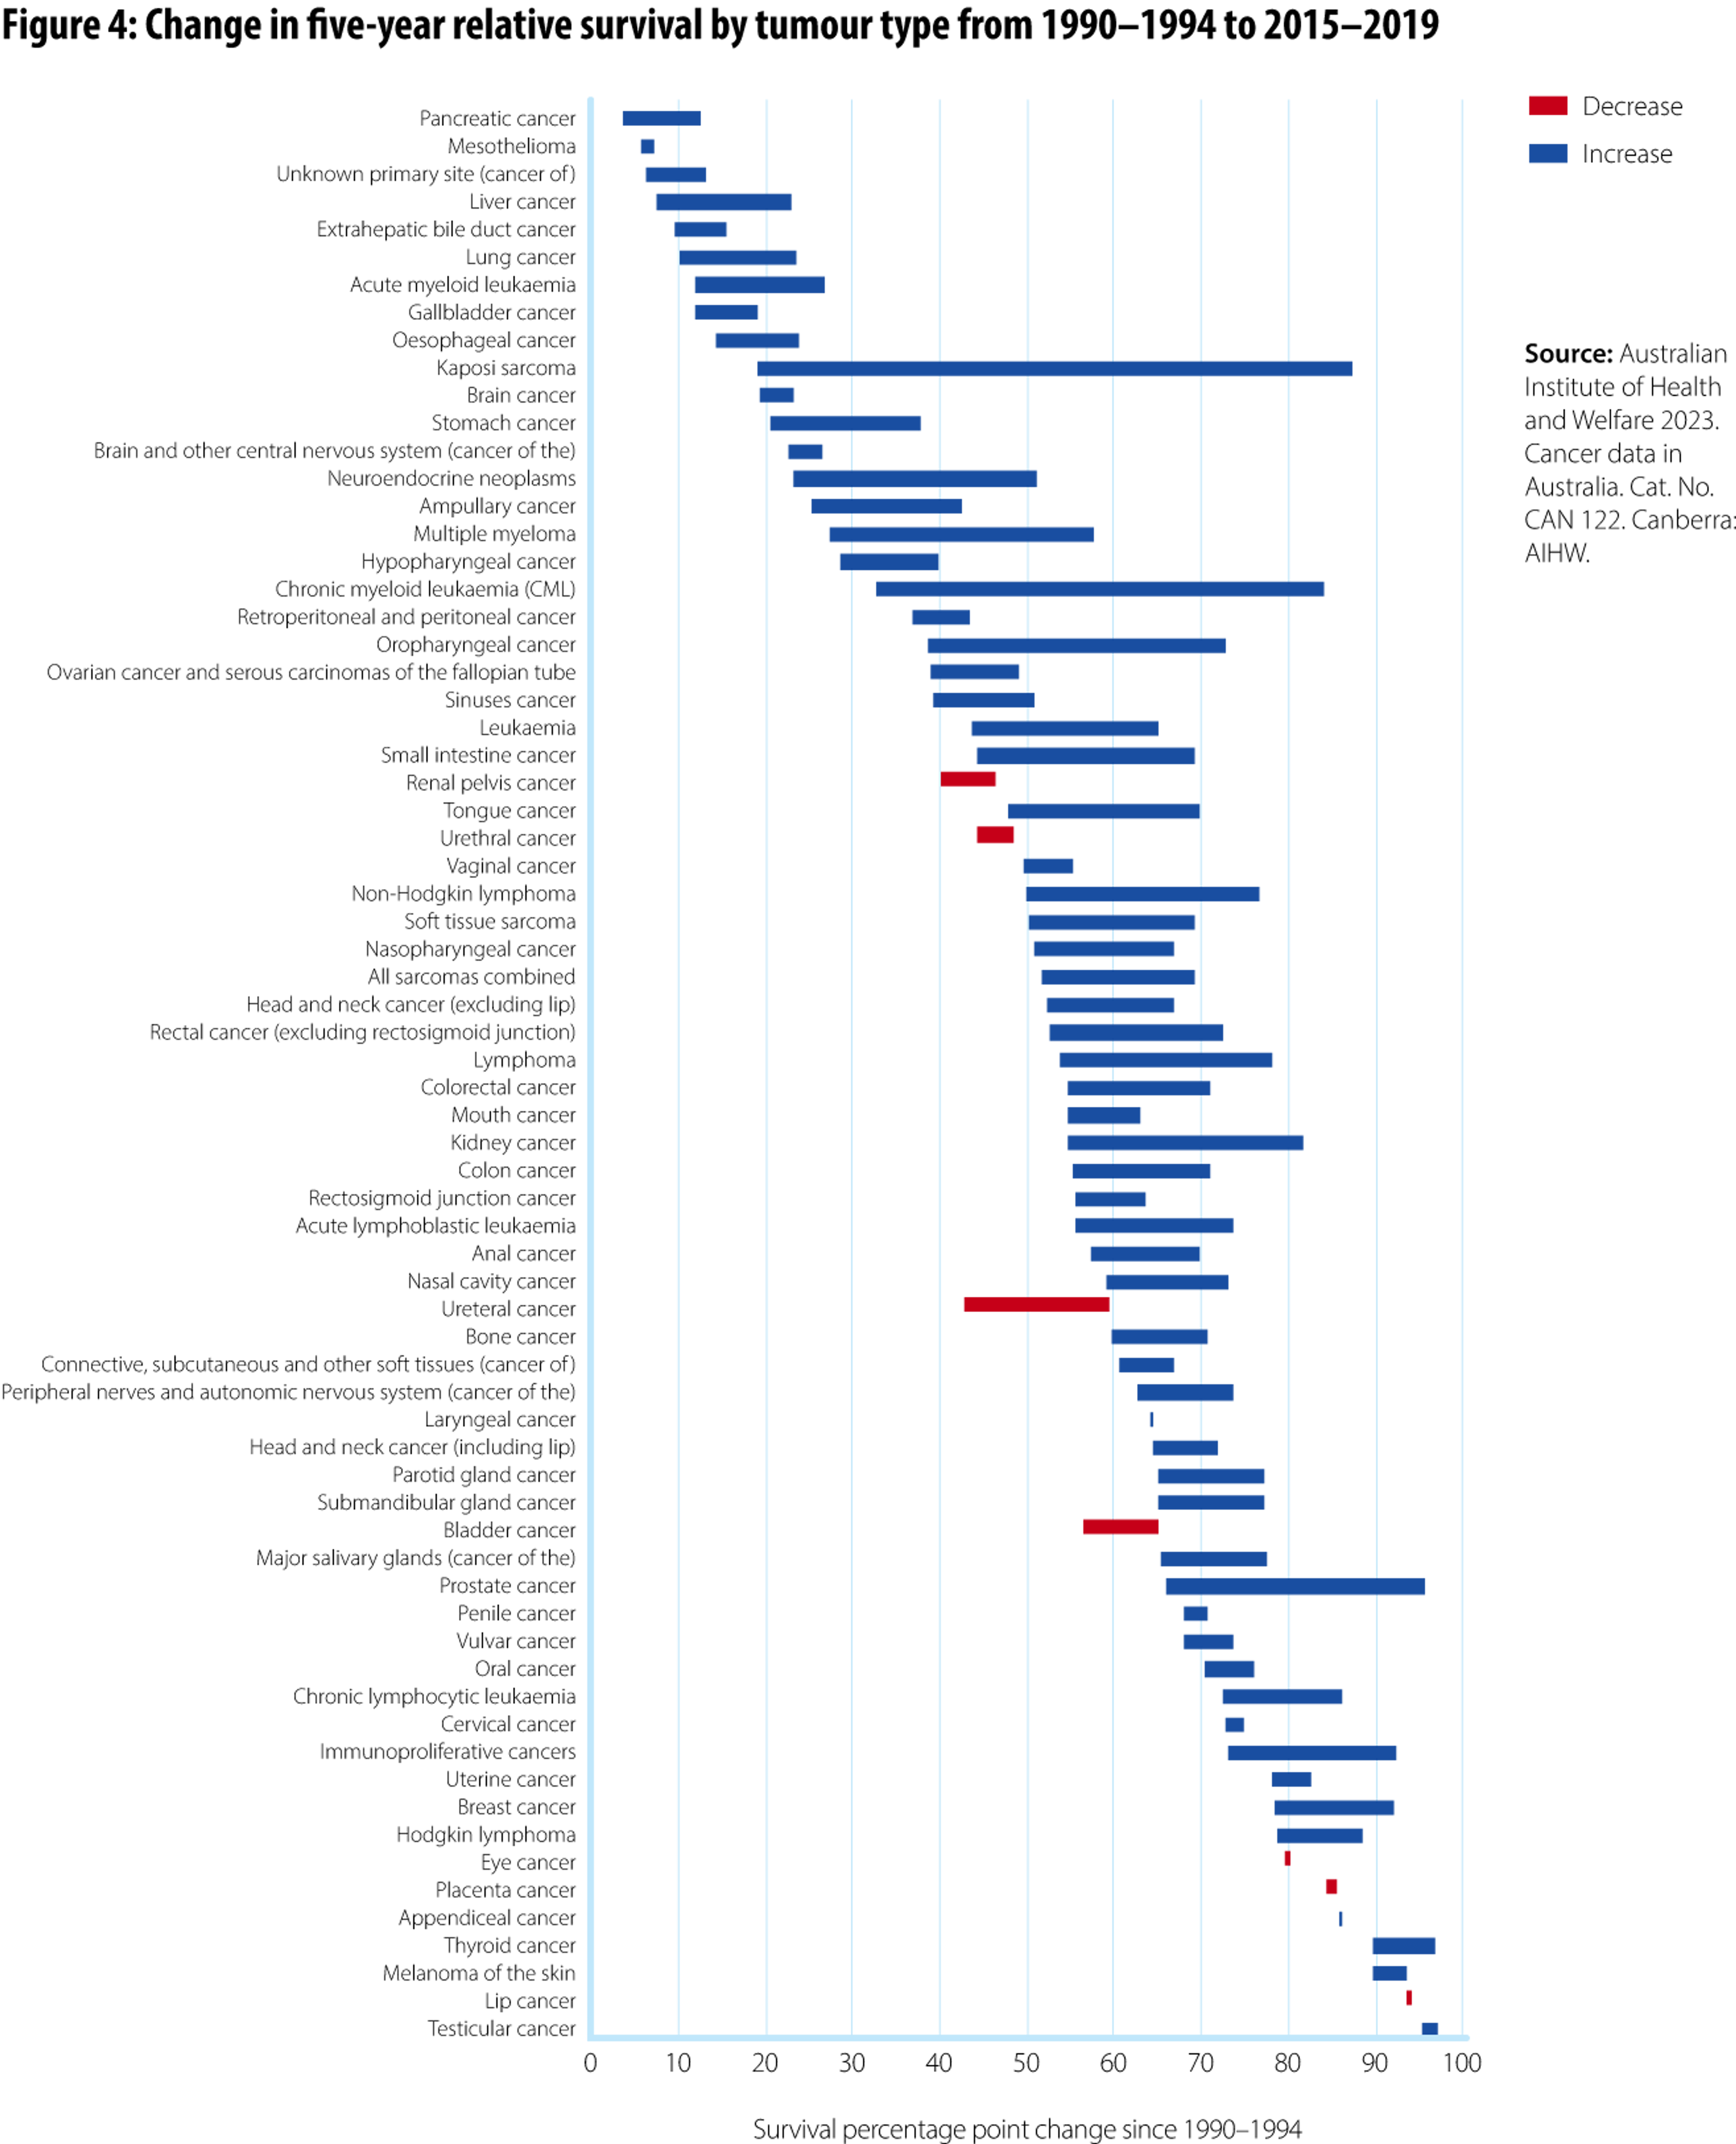
The improved survival rates over recent decades have been observed across most cancer types (see Figure 4) and are attributable to a range of factors, including the introduction of national screening programs, improved early detection, and improved treatments.[1] However, not all cancers have shown the same degree of improvement in survival, and for a few cancers there has been a decrease in survival outcomes over time (see Figure 4).
Although cancer incidence rates have stabilised, mortality rates have decreased and 5-year survival rates have improved, disparities in cancer outcomes still exist in Australia. A person’s risk of cancer, their experiences during diagnosis and treatment, and their survival is influenced by factors including where they live in Australia, their background and personal circumstances, and the type of cancer they have.[1]
Addressing these variations is a focus of the Australian Cancer Plan.
*The primary data set used is the Australian Cancer Database (ACD), which contains information on Australians diagnosed with primary, invasive cancer (excluding BCC and SCC of the skin). Since basal and squamous cell carcinomas of the skin are not notifiable, data on these cancers are not included in statistics from the ACD.